The 2024 revenues of the 4x largest multinational cement companies are certainly the first step towards generating a profit and a return for shareholders. The amount of profit generated depends on the costs incurred to achieve those sales revenues.
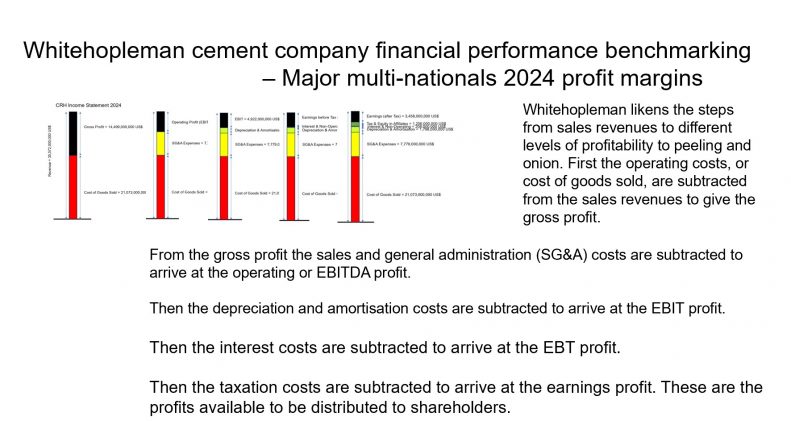
Whitehopleman likens the steps from sales revenues to different levels of profitability to peeling and onion. First the operating costs, or cost of goods sold, are subtracted from the sales revenues to give the gross profit. For a cement company this might be the costs of producing the cement on the cement factories. The costs of distributing the cement to customers might, or might not, be included in the cost of goods sold. In the Figure we can see that CRH’s gross profit in 2024 were just under 15 billion US$. More than Cemex’s total sales revenues.
From the gross profit the sales and general administration (SG&A) costs are subtracted to arrive at the operating or Earnings Before Interest, Taxation, Depreciation and Amortisation (EBITDA) profit.
From the EBITDA profit the depreciation and amortisation costs are subtracted to arrive at the earnings before interest and taxation (EBIT) profit.
From the EBIT profit the interest costs are subtracted to arrive at the earnings before taxation (EBT) profit.
From the EBT profit the taxation costs are subtracted to arrive at the earnings profit. These are the profits available to be distributed to shareholders. For CRH in 2024 the sales revenues had been eroded away to leave an earnings profit of just below 3.5 billion US$. Approximately 90% of the sales revenues were consumed by the different levels of costs. How that compares to the other major multinational cement companies is tomorrow’s story.